FusionDebug – Professional Debugger for ColdFusion
FusionDebug will lower your total development costs, improve CFML code quality and allow developers to focus on making great software.
Non-Intrusive Debugging
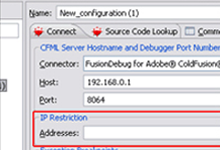
Debug supports IP Filtering, which allows breakpoints to only fire when requests are coming from a specified IP address. This makes it possible for a developer to debug and set breakpoints.
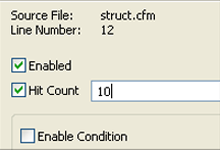
Conditional Breakpoints
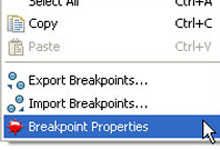
Have more control over when your breakpoints fire! Spend less time debugging, prevent convolution of production code with debug code and remove the need to disable breakpoints.
Auto-stepping
Vary stepping intervals to learn more about your application. For example, set a high stepping interval to watch the path of execution your application takes.

Testimonials
-
 FusionDebug allows you step through you ColdFusion code, one line at a time, as well as track the value of variables as you step through your code. FusionDebug is easily one of the best third-party tools ColdFusion Developers have at their disposal.
 -
 Thanks for all the help. Your customer service is unparalleled. Read Full Review
 -
 Wow! This is a great tool. Very solid and easy to use. It’s cut my development time in half. I’ve used it extensively with my AJAX implementations. It has provided me with some terrific insight into each request.
 -
 FusionDebug is Awesome. Love the product and responsiveness from your staff.
 -
 If you value saving time and working more efficiently then FusionDebug is the tool for you
Some of Our Fusion Customers

FusionReactor APM
Start Free FusionReactor Trial
Production Debugger Overview
FusionReactor’s debugger contains a fully featured, low overhead, ‘IDE’ Style debugging browser console as well as the ability to capture stack trace and variable context state at any point where you may set a breakpoint in your code. No need to write variables out to logs – just run FusionReactor and set a breakpoint and receive an email with all the information you need. Easily perform remote Java debugging for any JVM or Docker container.
Java IDE Debugger
All built into FusionReactor! The Java Debugger gives you all the control you need to simply and securely interact with your production environment as issues unfold. The insight it provides will revolutionize how you identify problems. Unlike a typical debugger, you can set up conditional breakpoints and be alerted by email when they fire. The email will contain a link to the debug session, as well as stack trace and variable details at the instant the breakpoint fired. It has NEVER been easier and faster to get to the root of issues.