Feature Focus: Full Stack Trace
See the chain of files, from when your custom tag reached your set breakpoint
A full stack trace allows you to see the chain of files from when your custom tag reached your set breakpoint. If you click on any of the pages in the caller chain then FusionDebug will show you that page and will highlight the line at which the next page in the chain was called. Additionally, if you click on a page, you will often see extra information about how it was called (arguments, parameters etc.)
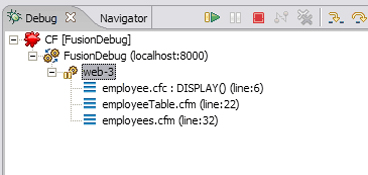
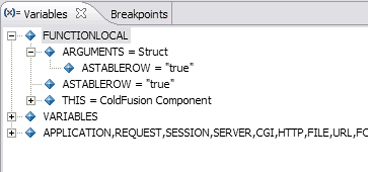
Here we have clicked on employee.cfc and we can see what arguments were passed (see left). As ColdFusion MX acquires more object-oriented features and becomes harder to manually debug, the Full Stack Trace feature is becoming more and more useful.